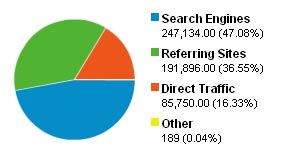
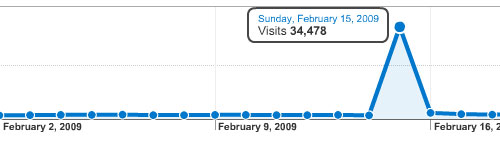
These are my Google Analytics stats for 2010.
Here’s how the visitors got here:
Of those that got here via referring links, here are the top ten sites that brought them here most often:
stumbleupon.com
facebook.com
www3.telus.net
google.com
de.wikipedia.org
en.wikipedia.org
fxp.co.il
images.google.com
digg.com
desgraciashumanas.blogcindario.com
Almost all of the top 50 search results were related to backmasking. Here are the top ten:
In case you’ve ever wondered exactly what to say in a first message, OKTrends (the blog from the dating site OKcupid) has compiled just the data you need to review.
Wrong Tomorrow is a site that tracks significant predictions by pundits of politics, finance and information technology, over a maximum 5 year time span.
Thomas Friedman: “Improv time is over. This is crunch time. Iraq will be won or lost in the next few months. But it won’t be won with high rhetoric. It will be won on the ground in a war over the last mile.” 2004-11-11
Jim Cramer: “Google goes down every day and that’s wrong. I don’t believe it’ll stay here long at all. It’ll be back to $500 in no time.” 2008-08-08
Bill Gates: “Two years from now, spam will be solved.” 2004-01-24
It turns out, the trend is that most experts’ predictions are worse than chance.
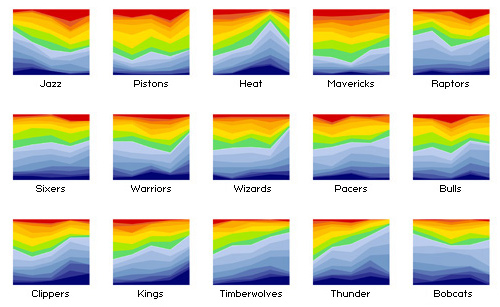
Heating up or cooling down? Obsessionism.com graphs NBA teams by their last five years of stats. This appears, at first glance, to be a pretty good indication of how the teams will do this year.
For the last ten years, obsessive record collectors in Usenet have been working on the Whitburn Project — a huge undertaking to preserve and share high-quality recordings of every popular song since the 1890s. To assist their efforts, they’ve created a spreadsheet of 37,000 songs and 112 columns of raw data, including each song’s duration, beats-per-minute, songwriters, label, and week-by-week chart position. It’s 25 megs of OCD, and it’s awesome.
Did pop songs stay on the top 40 charts longer in decades past? Were there more one-hit-wonders in the 60’s, 70’s or 80’s? He’s done some great parsing of some really big data sets, and the results are very interesting.
The American version of Deal or No Deal is airing its 100th episode. When I first watched the show, sometime close to it’s premiere, I was quite bothered by the fact that the game doesn’t really have much strategy to it. You don’t have to know anything, you just pick random cases—something that anybody could do.
Nevertheless, despite the aggravating stalling and the fact that I judged most of the contestants to be greedy morons, I found myself compelled to watch, at least for the first few weeks—each episode hoping that tonight would be the night someone goes home a millionaire.
The greed aspect used to bother me because at a certain point the risk involved in continuing far outweighs the statistical chance of gaining more money. I suppose that’s what makes the show so compelling and I have to admit that within every negotiation, there is a time to get out and a time to stay in, and success hinges upon selecting that sweet spot between too early and too late. I tend to admire those with the sense to get out early more than the romantics who go for it, because I’m not a high roller. Betting tens of thousands of dollars, even when the odds are on your side, is astonishingly reckless. I suppose though, either way it turns out, the suspense is very good for ratings and allows us at home to play vicariously—wondering what it is we would do when put in that same situation.
The following is a YouTube clip from British version of Deal or No Deal that aired last January. The host, or presenter, is a man named Noel Edmonds. The differs from the American version in that there are no lovely models to open cases. Instead they bring in 22 contestants and each choses a case at random. Then one person is selected to play the game and, like the American and Canadian versions, choses cases to open to eliminate from play.
It’ll all become clear in the clip but the main thing you need to know is that the folks opening the cases in lieu of the models are contestants who weren’t selected to play this round. Also, of course, the top prize is in pounds—it’s £250,000.
As of this morning the British pound was worth a hair under two bucks in American money so 250,000 of them is the equivalent of just under half a million US. If that seems horribly lower than the usual top prize in Canada and the States (a million dollars in our respective currencies), remember that on the North American shows, the top prize is in one out of 26 cases, not 22, so the odds are a little different.
Also note that, unlike the States, the winnings in the UK and Canada are tax free.
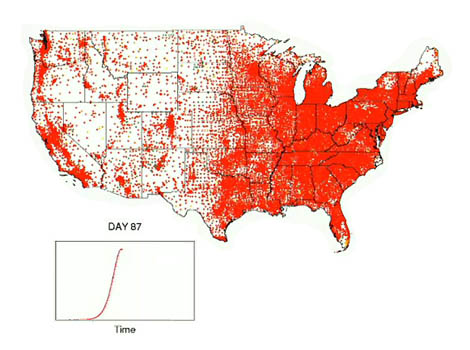
Using supercomputers to respond to a potential American health emergency, scientists from Los Alamos National Laboratory in New Mexico, the University of Washington and the Fred Hutchinson Cancer Research Center in Seattle have developed a simulation model that makes stark predictions about the possible future course of an avian influenza pandemic.
Based on today’s environment of world-wide connectivity, beginning with 10 infected people arriving in Los Angeles, the simulation predicts that the pandemic will spread quickly throughout the continental United States, peaking about 90 days after the initial introduction.
The computer simulation models a synthetic population that matches U.S. census demographics and worker mobility data by randomly assigning the simulated individuals to households, workplaces, schools, and the like. Department of Transportation travel data is used to model long-distance trips during the course of the simulation, realistically capturing the spread of the pandemic virus by airplane and other passenger travel across the United States.
“In the highly mobile U.S. population, travel restrictions alone will not be enough to stop the spread; a mixture of many mitigation strategies is more likely to be effective than a few strictly enforced ones,” said Kadau, also of Los Alamos’ Theoretical Division.
The number of symptomatic cases at any point in time is shown on a logarithmic color scale, with 1 or fewer cases per 1000 in green, 50 per 1000 in yellow, and 100 or more per 1000 in red.
57% of Ontario residents do not feel strongly that they have enough fun in their lives. A poll by Cranium/Ipsos-Reid also found that residents in Quebec (49%) are the most fun-filled people in Canada, especially compared to Saskatchewan and Manitoba, where just 24% of residents feel strongly that they have enough fun in their lives. Alberta came in second last with 68% of people reporting they don’t feel strongly that they have enough fun in their lives. It seems logical enough though, what with all those French circuses in Quebec—why wouldn’t they be happy?
Continuing with my statistically ample post, and on a slightly darker note, only 26 people are known to have survived the 220 foot drop from the Golden Gate Bridge. The number of jumpers has reached over 1000. I recommend this insightful New Yorker article about jumpers of the Bay Area’s famous bridge. (It’s a long one, but a good one).